
(The following was prepared by Roast magazine and SCAA staff.)
In March 2015, the Specialty Coffee Association of America (SCAA), in partnership with Roast magazine and Pacific Bag, Inc., initiated a project to collect detailed financial, operating and sales information from roasting companies around the world.
The organization contracted with Industry Insights, an independent professional research and consulting firm, to distribute confidential survey forms to 8,485 roasting companies in more than a dozen countries. Survey responses were submitted directly to Industry Insights, which processed and analyzed the data to ensure accuracy, consistency, confidentiality and statistical validity. The results of the survey are presented in the 2015 SCAA Roaster Financial Ratio Report, currently available at the SCAA store. The main objectives of the survey included:
- providing benchmark information against which roasting companies can compare their financial performance
- determining the challenges roasters face and can expect to face moving forward
- quantifying the market size of the roasting community in the United States and Canada.
The report is designed to help roasting companies evaluate their own performance against similar companies to identify improvement opportunities. Business areas examined in the report include overall performance measures, financial management ratios, employee productivity data, income statements, balance sheets, sales analysis, background information, operations, business environment, human resources and advertising/marketing. Most of the study results are reported as medians rather than means (averages). The median value represents the midpoint of the data for a particular measure, with one-half of the companies reporting figures above the median and one-half below.
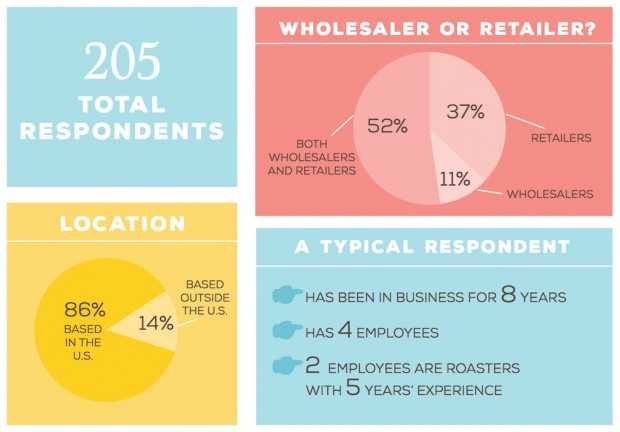
Meet the Respondents
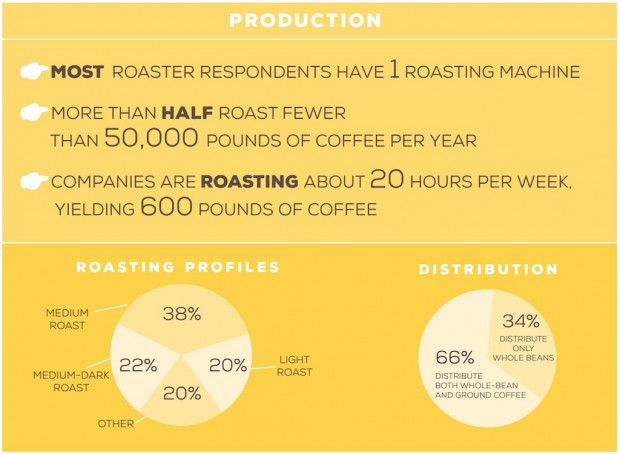
Sample Findings
The report is designed to help roasting companies evaluate their own performance against similar companies to identify improvement opportunities. Business areas examined in the report include overall performance measures, financial management ratios, employee productivity data, income statements, balance sheets, sales analysis, background information, operations, business environment, human resources and advertising/marketing.
Most of the study results are reported as medians rather than means (averages). The median value represents the midpoint of the data for a particular measure, with one-half of the companies reporting figures above the median and one-half below.
Sample Comparisons
The charts that follow provide a sample of the types of comparisons presented in the SCAA report. These sample charts include three of the eight groupings examined—all roasters, profit leaders, and net sales. Further analysis on these and the other five groupings is presented in the full report.
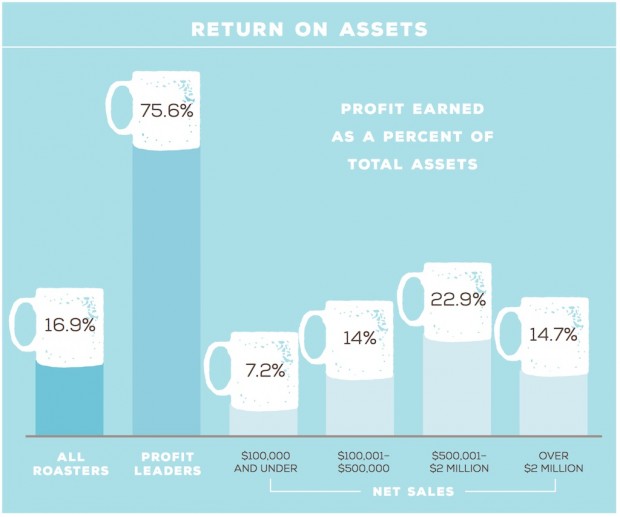
A good overall indicator of company profitability is the ratio “net profit before taxes as a percent of total assets,” or “return on assets,” as it is often labeled. Essentially, this provides an indication of the bottom line profit return being earned on money invested in total assets. The typical roaster’s return on assets during 2014 was 16.9 percent for the year. As shown above, the most profitable companies experienced a 75.6 percent return.
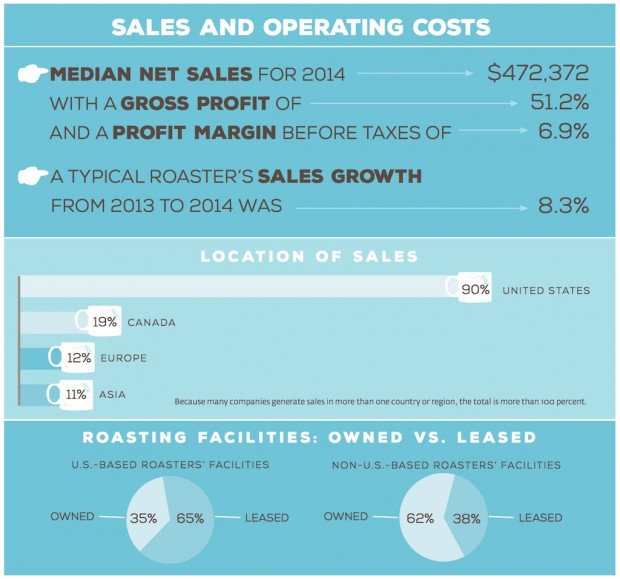
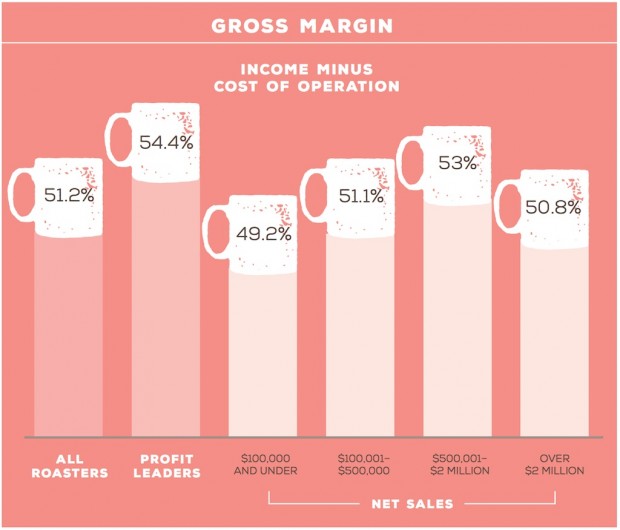
Gross margin indicates a company’s profitability after the costs of making or buying the product is subtracted from sales and other income-generating activities. This is a useful ratio to measure a company’s pricing strategy and operational efficiency. In 2014, the typical roaster saw a gross margin of 51.2 percent, while the profit leaders had an operating margin of 54.4 percent. The smallest companies in terms of net sales reported the lowest gross margin of all sales groupings, at 49.2 percent.
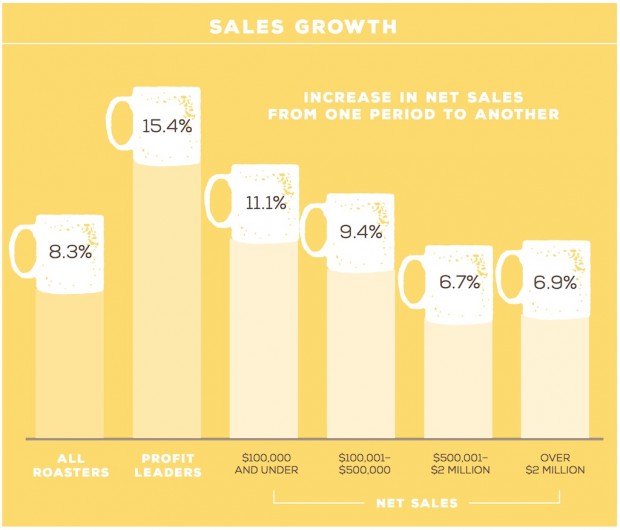
Sales growth is calculated by determining the difference between current year net sales and prior year net sales, then dividing that value by the prior year’s sales. Monitoring sales growth is important as it often drives a company’s performance and ability to achieve profitability. During 2014, most companies reported positive sales growth.
The typical roaster reported an increase of 8.3 percent, with profit leaders reporting growth of 15.4 percent. Those companies with sales of $100,000 or less reported the largest growth of any sales grouping, with a sales increase of 11.1 percent from 2013 to 2014.
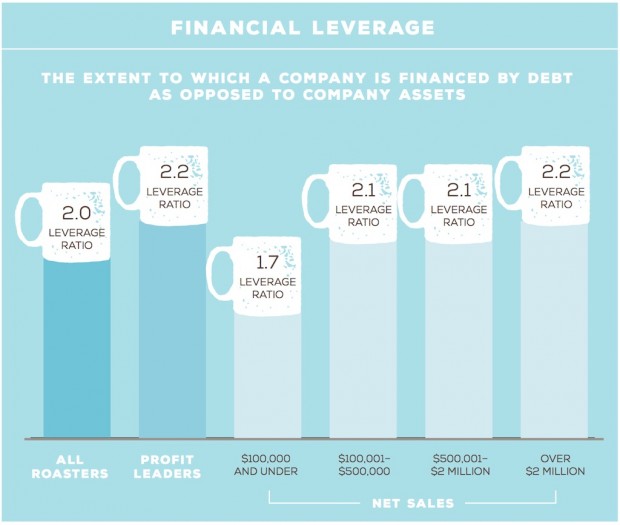
Financial leverage is the amount of financial liability compared to the amount of net worth. Overall, respondents reported a leverage ratio of 2.0 in 2014. This means they have twice as much debt as equity in the company. As Industry Insights explains, “Although some owners do not like borrowing any more than absolutely necessary, additional debt will increase overall profitability as long as the business can earn a before-tax return that exceeds the borrowing rate.” The full report includes a more detailed explanation and advice in this area.
Profit leaders were more heavily leveraged than the typical respondent, reporting a leverage ratio of 2.2. There appears to be a relationship between the size of the company and financial leverage, as those in the $100,000 or less grouping indicated a leverage ratio of 1.7, while the largest companies indicated a value of 2.2.
This brief preview of the 2015 SCAA Roaster Financial Ratio Report is intended to provide an overview of the types of information included in the full report. The complete report presents detailed finance and operating information in narrative and table formats, as well as advice about how to interpret the data for one’s own business purposes.
Download a copy of the full report ($175 SCAA members, $375 non-members, free to survey participants).
Nick Brown
Nick Brown is the editor of Daily Coffee News by Roast Magazine.


Comment