

Coffee, with a capital C, is a fragile organism.
Its supply is essential to the billions of people depending on it in their cups, as it is to the millions of people who work to put it there. We consider coffee supply on a daily basis as it applies to present and future needs. But rarely do we consider its past.
Most immediately, concerns surrounding climate change, organic pests, consumer behavior, and any number of volatile market factors come to mind. But these are not only the supply problems of the future. They have been repeated over decades and generations, reflecting the cyclical nature of production and consumption in an always complex and evolving global market.
Perhaps no organization has more perspective on the modern history coffee supply than the International Coffee Organization, the 51-year-old body originally established in collaboration with the United Nations that to this day oversees the International Coffee Agreement, representing all the world’s coffee producing countries and nearly all the world’s consuming countries.
Earlier this year, the group published a monumental report on the market history of coffee, one that provides an arguably frightening view of the past and future coffee supply. We plan to extract some key points from that report in a multi-part series, beginning here with here with a brief history of coffee production over the past 50 years. The period is easily divided in two: The regulated period under the International Coffee Agreements from 1963 to 1989; and the subsequent free market period since 1990, following the collapse ICA negotiations in 1989. The ICO explains:
Up until 1989, the coffee market was regulated by a series of International Coffee Agreements which were intended to manage supply and maintain price stability. This system subsequently collapsed, and since 1990 the coffee market has been subject to the free market forces of supply and demand.
This breakdown was disastrous for many people along the supply chain, as the ICO’s composite indicator price for coffees dropped by nearly 75 percent in the subsequent five years, from $1.34 USD per pound in 1989 to an average of $0.77 per pound through 1995. That said, the deregulation also lead to immediate increases in supply opportunity, laying the foundation for the free global market we are familiar with today.
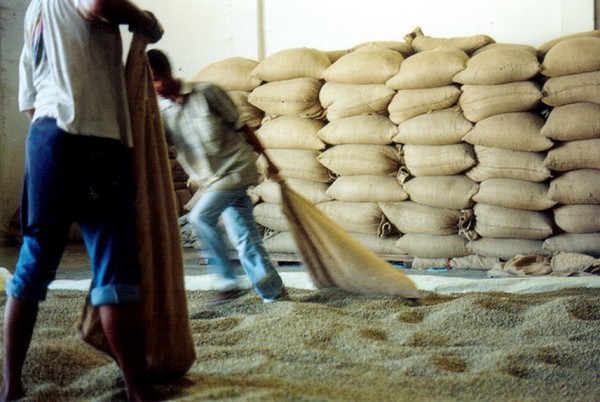
Here, using data and statistics compiled and shared by the ICO, is a brief history of coffee production in the modern era, before and after free market forces took control in 1990:
Arabica vs. Robusta
Robusta coffee production increased by more than 100 percent from 18.8 million bags per year under the regulated market (1963-1989) to 39.3 million bags per year under the free market (1990-2013). This past year, robusta production was estimated at 56.5 million bags, representing a 38.9 percent share of the world’s coffee production, up from a 27.5 percent share in 1990. Vietnam has seen by far the biggest share of robusta production growth in the free market period.
By comparison, arabica production last year was estimated at 89 million bags, representing 61.3 of the world’s coffee production. That’s down from arabica’s 72.5 percent share in 1990. In the regulated period, arabica production averaged 57.5 million bags per year, compared to 73.4 million bags per year since 1990.
Africa
As a producer, Africa has suffered most from the deregulated market, and is the only growing region to have negative growth over the past 50 years. Africa averaged 19.1 million bags in the regulated period, down to 15.8 million under the free market, representing a decrease in the world’s share from 25 percent to 14 percent.
The ICO attributes these declines to a number of factors, including structural factors and aging coffee trees resulting from a deregulated market channel to Europe, local deregulation programs throughout the 1990s and regional conflicts affecting specific countries. Production last year was at 16.7 million bags, representing what the ICO has called “stagnation under 20 million bags” since 1990.
Here is a country-by-country breakdown of some of the most dramatic gains and losses in Africa over the past 50 years:
- Angola: Once responsible for 5 percent of total world coffee production in the mid 1970s, the country produced a mere 33,000 bags last year. The ICO notes that there are some coffee rehabilitations being carried out in Angola that could begin to reverse this trend in the immediate future.
- The Democratic Republic of Congo and Madagascar have also lost significant market share, down to 327,000 and 522,000 bags, respectively.
- The Ivory Coast has gone from producing an average of 4 million bags in the controlled market, down to approximately 2 million bags last year.
- Cameroon was down to 366,000 bags last year, compared to an average of 1.5 million bags prior to 1990.
- Kenya: Average production in the free market has been down to 1 million bags, compared to 1.3 million bags prior to 1990.
- Tanzania has been the most consistent among the African countries, and last year produced 1.1 million bags, which is higher than its averages over the past 50 years.
- Ethiopia and Uganda are the only two African countries that have experienced substantial growth in the free market period. Ethopia, in particular, has grown more under the free market ($3.6 percent) since 1990, than it did under the controlled market. The country produced an estimated 6.4 million bags last year. Uganda’s total output varied only slightly upward during the free market period, and the country produced 3.7 million bags last year.
Asia and Oceania
Asia and Oceania have made strong growth in the world coffee market in the past 50 years, particularly during the past 20 years with the huge development of robusta production in Vietnam. From 1963 to 1990, the region represented 9.7 percent of the world’s production, and that number spiked to 23.5 percent (a yearly average of 26.5 million bags) from 1990 to 2013. The region’s growth continues, producing 42.4 million bags last year.
Here’s the breakdown:
- India has more than doubled its output to 4.2 million bags during the free market period beginning 1990, with 5.5 million bags produced last year.
- Indonesia has nearly doubled its share of the world’s coffee production since 1990, to 6.8 percent (12.7 bags) in 2013. The region produced an average of 4 million bags during the controlled period between 1963 and 1989.
- Vietnam: Production last year was estimated at 22 million bags, compared to 1 million bags in 1990. The 1980s and 1990s saw annual successive increases, although production has fluctuated due to crop cycles since 2002.
- Papua New Guinea and Thailand have each also seen increases in the free market period since 1990, and produced 717,000 and 608,000, respectively, in 2013.
Central America and Mexico
Total production has increased in Central America and Mexico to an average of 18 million bags in the free market period, up from 13.8 million in the controlled period, although the region’s share of the world’s market has decreased, from 18.1 percent to 15.9 percent. As we’ve covered extensively on this site, output in Central America and Mexico has been substantially affected by leaf rust disease (la roya) in the past two years. As a result, many of the countries in Central America had an output similar to that in 1990, resulting not in negative growth but in a smaller share of the global market.
Here’s the breakdown:
- Costa Rica produced 1.7 million bags on average during the controlled period, up to 2.1 million bags from 1990 to 2012. Last year, production was estimated at 1.6 million bags.
- El Salvador‘s production has decreased during the free market period, from an average of 2.5 million bags from 1963 to 1989 to 1.9 million bags since. Production last year was drastically down to 1.4 million bags.
- Guatemala has flourished during the free market period, producing an average of 4 million bags since 1990, compared to 2.4 million bags prior. Production last year was 3.7 million bags.
- Despite occasionally rough periods, Honduras has seen the most growth among Central American countries in the free market period, up to 2.9 million bags on average since 1990 from 1 million bags prior. Production was estimated at 4.5 million bags last year.
- Mexico During the free market period Mexico recorded an average annual production of 4.5 million bags compared to 3.9 million bags during the preceding period. Mexico’s production in crop year 1989/90 was 5.1 million bags, a level reduced to 4.3 million bags in 2012/13, in part as a result of the coffee leaf rust epidemic that is rife in the region. Despite a recent decrease, Nicaragua has recorded an increase in its production during the last 50 years. Annual production from 1990/91 to 2012/13 averaged 1.3 million bags compared to 747,000 bags between 1963/64 and 1989/90. Production in crop year 2012/13 fell to an estimated 1.9 million bags compared to 2.2 million bags in the preceding year.
South America
Led by Brazil, South America has been the world’s largest coffee growing region throughout the past 50 years, accounting for nearly 47 percent (an average of 52.5 million bags) of the world’s coffee production since the free market took hold in 1990, and 47.2 percent during the controlled period from 1963-1989. For crop year 2012/13, total production was estimated 67.6 million bags, up 25 million bags from 1990.
Here’s a country-by-country breakdown of South America’s biggest producers:
- Brazil production has flourished since 1990, increasing from an annual average of 22.6 million bags during the controlled period to an average of 35.7 million bags since. The country’s 2013 output was estimated at 50.8 million bags, compared to 23.2 million bags in 1963.
- Colombia‘s annual production has increased slightly in the free market period to 11.5 million bags on average, compared to 10.1 million bags in the regulated period. That takes into account significant decreases in production due to leaf rust disease that most affected crops between 2008 and 2012. With government assistance and replanting of more disease-resistant varietals, the country’s crop rebounded to 10.4 million bags in 2013.
- Production in Ecuador has declined in the free market period, from an average of 1.4 million bags from 1963 to 1989 to 1.2 million bags since. That decline is due to an intense fall-off of production between 1990, when Ecuador produced 2.2 million bags, to last year, when it produced some 828,000 bags.
- Peru, now South America’s third largest producer, has flourished recently, increasing its production last year to an estimated 4.5 million bags, up from an average of 2.7 million bags since 1990. The country’s production has been up 7 percent overall in the free market period.
Nick Brown
Nick Brown is the editor of Daily Coffee News by Roast Magazine.

Comment
2 Comments
Comments are closed.

Having very little knowledge of the amazing journey the coffee bean makes until my son made me aware, I see the value of the fair trade system and I’m trying to encourage friends to be aware and enjoy good coffee>
As far as I understand, Brazil has been the World’s top coffee producer since 1880.