

In an effort to encourage positive and educational discourse on a range of issues that affect smallholder coffee farmers, Michael Sheridan of the CRS Coffeelands Blog has launched a series on featured comments.
With permission, a “featured comment” from Thomas Oberthur, Ph.D., is in full below. Oberthur’s technical and enlightening observations came into a response to Sheridan’s introduction last month of a draft version of a new kind of cupping form — one for farmers. Before we get to the full comment, Sheridan gives us some background on Oberthur’s work in the coffee field:
He was part of the research team at the International Center for Tropical Agriculture (CIAT) that worked with Green Mountain to reveal the scope of seasonal hunger in the coffeelands — work that many in the industry know. But he was also involved in what may be the best coffee quality research that no one in the industry seems to know much about: the work he did with former colleagues from to identify key drivers of coffee quality and map areas whose environmental characteristics suggest they are likely to produce coffees of exceptional quality.
This is going to get pretty technical, so as Sheridan suggests, “Put your thinking caps on.”
Thomas Oberthur on the Farm-Facing Cupping Form and the Coffee Quality Gap
Michael:
Our ongoing debate over your proposal for a farm-facing cupping form kept me thinking. I felt that I was missing something that didn’t let me see the proverbial forest through the trees. I drew up the concept of a “quality gap” to help systematize the issue. It may clarify how information from the cupping table can potentially improve field management.
I conceptualize four quality gaps:
-
environment
-
genetic material
-
agronomy
-
management
Unfortunately, only quality gaps 3 and 4 are fully controllable. Growers and their supply chain partners can only partially control factors contributing to quality gap 2, and factors contributing to quality gap 1 are largely beyond a growers’ controlmay only be mitigated to a degree). See Figure 1 below for more on how information generated through cupping can drive improvements in management practices in the field and wet mill.
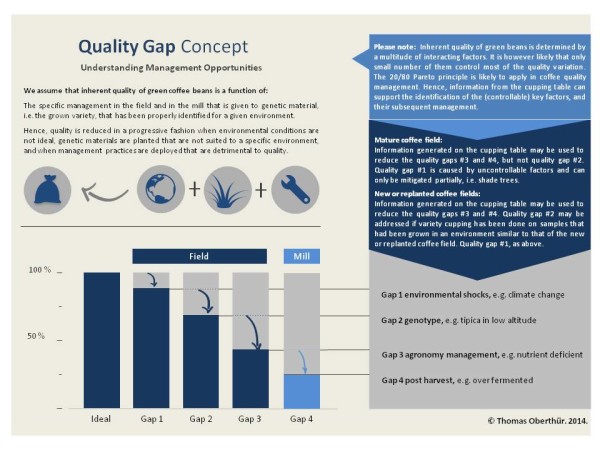
Figure 1. The Quality Gap Concept.
Michael, you also alluded in your comment to work that my previous team at the International Center for Tropical Agriculture (CIAT) recently did on mapping the potential of a particular region to produce green coffee with high inherent quality. In this approach we focused on characterizing the potential of environment by genotype interactions to support the production of high quality beans. We did this work with Colombia’s Federación Nacional de Cafeteros (FNC) for six Colombian departments as part of the FNC’s Denomination of Origin Application at the EU. We published the results for two departments in the paper “Regional relationships between inherent coffee quality and growing environment for denomination of origin labels in Nariño and Cauca, Colombia.”
For this work, focused essentially on quality gaps 1 and 2, we surveyed a number of different modeling approaches that exist to identify suitable niches for crops, and we decided on Bayesian probability modeling. The approach creates probability tables of all predictor variables (in our caseenvironmental characteristics) against response variable categories (in our case coffee quality). Our predictor variables included climate and topographic factors, while the response variables were related to different aspects of coffee quality: sensorial (standardized cupping), physical and biochemical.
The primary output is a discrete probability distribution of the potential for a certain coffee quality at each analyzed location. The distribution consists of the probability that the response variable is in each potential state (i.e. each considered quality level). This information can be used to create maps showing the most likely response value (i.e. ‘most likely quality’). Once locations have been identified where a particular response is likely, further analysis can be carried out to determine which predictor variables are important.
These important predictor variables (we call them ‘quality driving factors’) can either have a positive or negative effect on quality, and can help with the analysis of specific conditions required for specific coffees. Below is an example given in Figure 2.
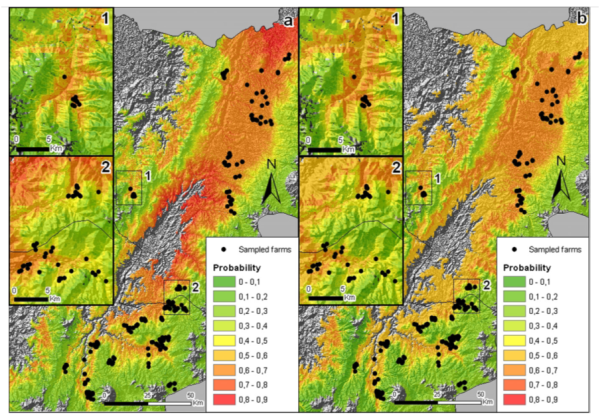
Figure 2. Identification of high quality niches: Probability of the beans produced in Cauca and Nariño to have high acidity (left map) and high flavor (right map) content (from Oberthür et al, 2011).
Since the approach is data driven, cupping and other bean quality information is required to establish a baseline (response variable) of what we believe constitutes “quality.” And the more data are available, the better.
Apart from cupping table information that was generated by the FNC laboratory, we also used physical bean characteristics and bio-chemical and near infrared information. The latter two sources provide for rather objective information, free of bias related to perception or preference. During the field implementation, genotype was kept constant (we included only samples from known specific varieties) and harvest and post harvest management was partially controlled (we developed a mobile field processing station with which we were able to standardize harvest and post harvest management, see a photo below).
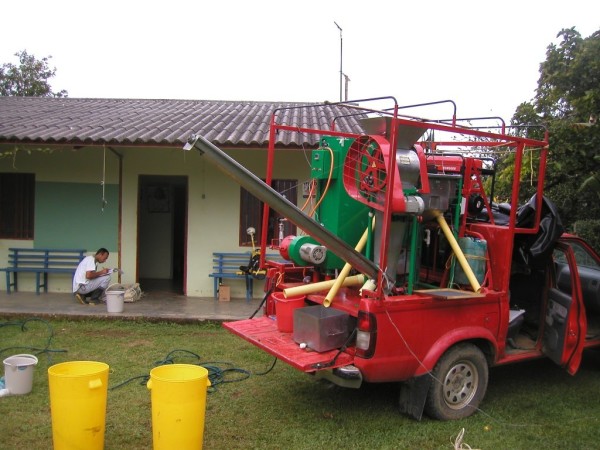
Figure 3. The mobile processing unit that we used in the field to wash, ferment and dry samples that had been harvested following a standardized protocol.
Agronomy practices were beyond our control, and we tried to make up for this by obtaining a large number of samples. This approach works at a geographic scale that is beyond operational farm management. It supports however the strategic decision as to which varieties may perform well on a given farm that is located within a demarcated quality domain.
Apart from the work with the FNC, we had several smaller studies that involved high-end roasters (some of whom are working with you now on your Borderlands project). In any case, it is critical that cupping uses standardized processes and agreed upon protocols in order to remove personal bias. The analyses presented above would benefit mainly from higher-level quality information that describes degree/intensity of acidity, general nature of flavor, degree of sweetness, and level of body. Detailed description of specific flavors and taste notes, or descriptions of very specific expressions of acidity and sweetness are probably less useful. Quality should be described in quantitative terms as much as is possible.
Getting back to your proposal for a farm-facing cupping form, the question is: Can a similar approach be used to improve systematically quality within a farm or within a group of farms in smaller region for operational management decisions? Most certainly this could be done.
To use information from the cupping form to support management, we need to have the knowledge about the underlying causal relationships between the presence of certain quality traits/taints and specific management practices. And here is the bottleneck: our understanding of those relationships is limited at best.
We have some understanding of what is causing quality gap 4, but very little understanding of what is behind quality gap 3. The process you propose is an opportunity for information that can be captured during cupping to make a real difference.
As stated above, cupping information is of limited use to reduce quality gaps 1 and 2. In my opinion, a prior quantification of the actual value that a quality gap represents is necessary to understand whether or not there is an incentive for growers to change management with the aim to reduce quality gaps. This is critical and crucial, as the value of better information is, that it provides a solid base for decision-making, and thereby enables the discovery of income-generating opportunities or avoids costly errors, which we would characterize in statistical analysis as type I and type II errors.
A type I error occurs when an alternative hypothesis (e.g. my farm produces high quality when beans are rustically fermented in old plastic bags that were used to pack fertilizers) is accepted incorrectly due to a chance observation (e.g. a one-time award at a Cup of Excellence competition), whilst a type II error occurs when an alternative hypothesis is inapproapriately rejected even though it is the true (e.g. I did not apply fertilizers in the year I placed well in the Cup of Excellence, and hence, I will stop applying fertilizers). A type I error occurs when a producer fails to act in a way that is of potential benefit. Farmers are commonly thought to make type I errors due to risk aversion (although, there is evidence to question this generalization). But most type I errors are probably due to ignorance of better options, suggesting that improved access to pertinent information (amongst others from the cupping table) could reduce type I errors.
Type II errors occur when farmers take actions that are actually harmful, or at least non-beneficial. All farmers wish to avoid these errors, yet I suggest they persist because farmers are unaware or are uncertain of the most probable outcomes resulting from their decisions. If this is the case, then it is clear that improved provision of information (from the cupping table) is necessary if both type I and type II errors are to be reduced. Farmers are natural experimenters, given the right incentive and the right information there is no question that information from the cupping table could drive an experimental process that leads to further improvement in quality (let’s talk about the actual design of such a process in another post, if you wish to do so).
The particular characteristics of the production environment and management practices are reflected in the unique traits of coffee. This provides an opportunity to differentiate beans through systematic and targeted deployment of specific practices, but also presents a problem in that until recently it was not possible to collect and interpret information on how the variation in management and environment affects product traits. Coffee growers already know that options for differentiating their commodity into specialty coffee are available; however, they know little about where and how they can satisfy particular market demands. Cupping information about variation in coffee quality and the definition of the environment and the management practices that are associated with certain quality characteristics or coffee identities could provide a practical guide for producers to decide what options are feasible under their specific local conditions. This information is not at present readily available, although systems to capture and analyze this information are becoming more used in the industry.
To use information from cupping forms to guide management it is indispensable to first describe (a) the production environment, and then (b) to track and monitor the nature and the timing all deployed management practices. Only then can we relate back the information from the cupping table to field and mill management. Two issues remain: including (a) how to deal with the complexity of the system and the multitude of factors that simultaneously impact on quality, and (b) how to calibrate cupping procedures with the aim to understand variation in the perception of specific quality aspects between different cuppers so that information from a large number of different cuppers can be used.
Nick Brown
Nick Brown is the editor of Daily Coffee News by Roast Magazine.


Comment