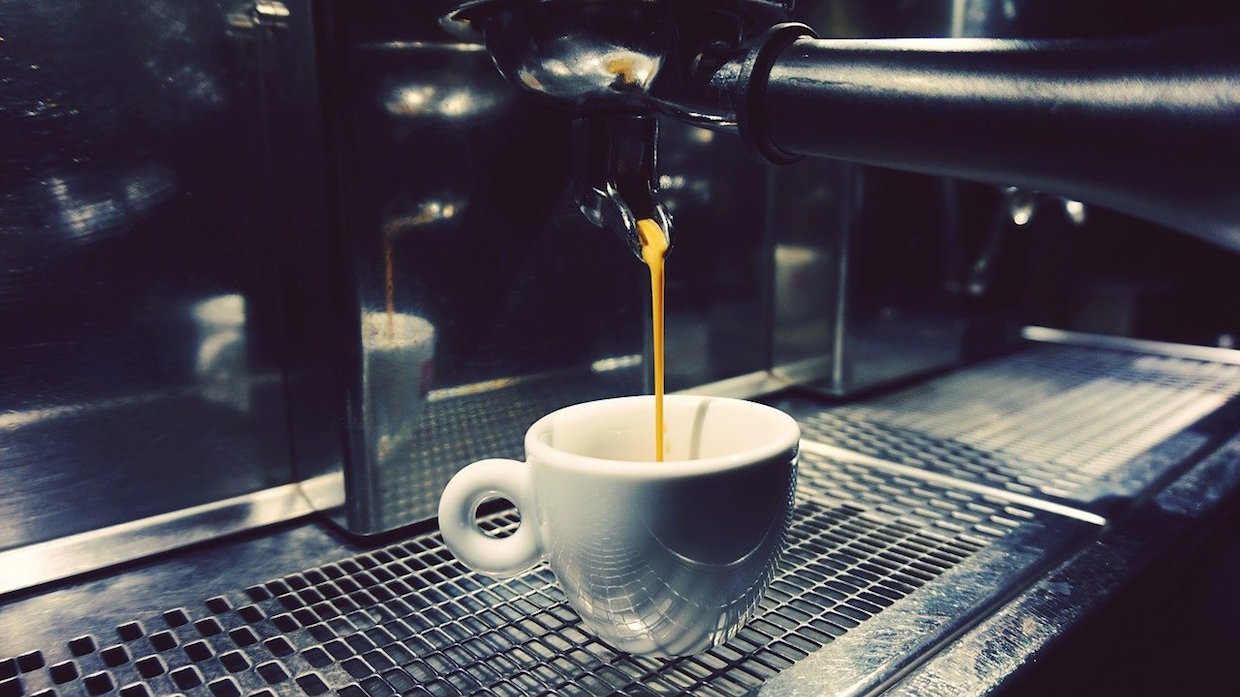
Photo by Coffee Geek from Pexels.
As coffee prices on the commodities market have been at historic lows over the past two years, the topic of prices has been a deservedly hot one in the coffee industry.
Much attention has been paid to price-setting and price discovery as it relates to the green coffee market. In other words, progressive players within the industry have responded to calls from farmers and producer groups that prices are often unsustainably low, not meeting costs of production and threatening the supply of quality coffee as a whole.
Much less attention — publicly, at least — has been paid to the intricacies throughout coffee supply chains that ultimately drive up the prices of roasted and brewed coffee as paid by consumers.
Adding to the prices conversation, the Specialty Coffee Association has stepped in with a revised version of its supply-chain-spanning graphic called “Economics of the Coffee Supply Chain: An Illustrative Outlook,” which provides a broad representation of the economics of the coffee supply stream.
“At the SCA, one of the most common questions we are asked has to do with how coffee is priced,” SCA Chief Research Officer Peter Giuliano wrote in an announcement of the graphic’s release yesterday. “How much of the cost of a cup of coffee comes from transporting the coffee from its place of origin, or from roasting loss, or from the labor at the coffee shop? The coffee chain is complex, so it can be hard to pin-point all of the different factors influencing the final price of a cup of coffee.”
To create the graphic — which is free for download for SCA members and non-members alike — the group culled data from its 2017 roaster and retailer benchmarking study and from its market reports created in collaboration with payment processor Square.
The result is an FOB-to-net-retail-profit snapshot of what the SCA calls a “typical supply chain.” It should be noted that the numbers used are reflective of data and exist in the hypothetical realm.
For example, while the FOB price for green coffee may vary widely from contract to contract between buyers and sellers of all kinds, the Outlook uses a price of $3.24 per pound. And while one pound of roasted coffee in the cafe comes out to $42 per pound in profit, the numbers begin to shrink with expenses such as the cost of roasted coffee ($9.40 per pound), stir sticks ($0.30), labor ($8.82), state and federal taxes ($1.94) and so on, ad nauseam.
“The exact amounts will vary based on many factors, such as location for example, but this Outlook represents accurately the ratios or proportions of the different parts of the value chain,” the SCA stated, noting that an initial version of the graphic was released in 2014.
The group suggests the Outlook could be potentially useful for producers in better understanding the business models of their buyers and other upstream actors; and for baristas, shop owners and other coffee industry people looking for a better understanding of the typical costs paid by their peers.
Download the graphic here.
Nick Brown
Nick Brown is the editor of Daily Coffee News by Roast Magazine.


Comment