

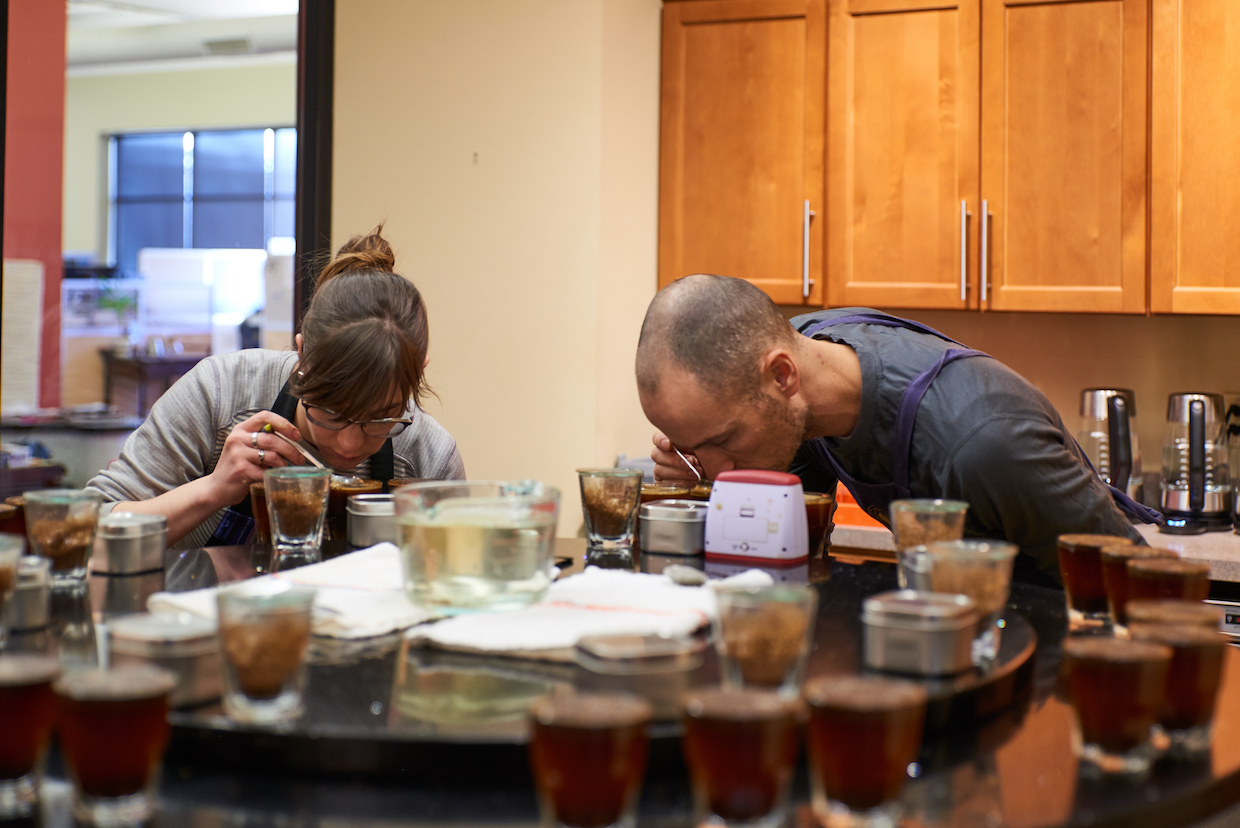
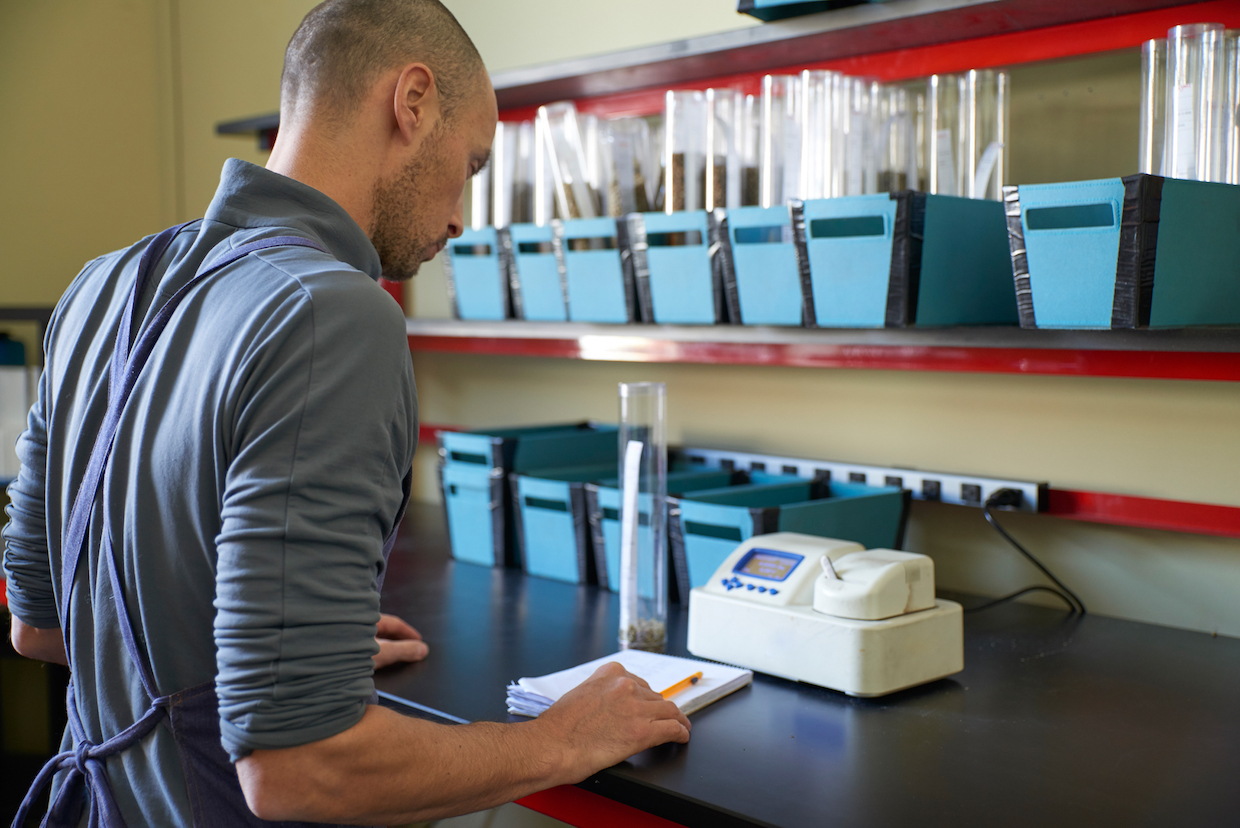
Cupping at Cafe Imports in Minneapolis. All photos courtesy of Cafe Imports.
Over the past six years, sensory analysis experts at Minneapolis-based green coffee importing company Cafe Imports have been diligently recording water activity and moisture content in coffees in between their many thousands of cuppings.
As a result, they’ve ended up with what is certainly the most robust data sets on water activity in coffee to date, and just this week they’ve graciously shared those data with the rest of the coffee world.
Led by Cafe Imports Director of Sensory Analysis Ian Fretheim, “Water in Coffee: A Long Term Observational Study” spans more than 100 pages while illuminating some of the most relevant findings on water activity (often written as Aw) based on more than 25,000 data points from shipped coffees and pre-shipment samples from 44 countries.
From a practical view, Aw is most commonly considered relevant to the shelf-life of green coffee, and particularly the flavors that constitute coffee’s unique qualities. As Cafe Imports set out to explore that relationship, Fretheim and the team also dove into Aw’s relationship to roasting, its effects on lipid oxidation, its fascinating relationship to moisture content, and much much more.
However, for as informative as these explorations may be, the report ultimately seeks to put water activity in its rightful place, at one point plainly stating, “Many of the primary problems associated with high water activity do not impact us in specialty coffee.”
While there are plenty of correlations to be currently drawn and much further research to be conducted, the company Fretheim ultimately concludes that the coffee industry — or the specialty coffee industry, in particular — may not be ready for Aw standards.
To put it simply, the relationship between Aw and shelf-life or quality may not be significant enough to reasonably force parties farther down the supply chain to spend potentially thousands of dollars on equipment and revise their packaging and warehousing protocols.
Writes Fretheim, “Until practical data beyond general principles can be shown to support such a standard, and until water activity can be shown to offer a significant improvement over less-burdensome measures, standards for water activity in specialty coffee can serve only to reinforce the power structures by which the coffee-buying world (at least those parts of it that can afford to run water activity testing) dominates the coffee-producing world.”
We caught up with Fretheim to ask more about the report, its findings, and what it might mean and to whom in the coffee world.
DCN: Can you briefly explain the fundamental difference between moisture content and water activity? And why that difference matters so much for green and roasted coffee?
IF: With moisture content, we’re measuring the amount of water in the coffee bean. We report that as a percent, e.g. 10 percent. This means exactly what it sounds like — 10 percent of this coffee bean is moisture.
Water activity measures the energy status of that 10 percent water. So two identical quantities of water could have very different water activities, in particular if they are found in different systems.
This is important for coffee, and for many things besides, because when we get down to it we’re always talking about energy costs and requirements. Molds, for example, need water, but what they really need is access to water. They can only function when access to water is easy enough; that is, when water activity is high enough. It doesn’t exactly matter how much moisture is there. It matters what the energy status of that moisture is.
You mention that there’s a .7000 Aw standard for coffee? Can you explain what that standard means and how it may not be a particularly useful figure?
Below 0.7000 is really where things start slowing down in terms of microbial activity and other transformations. This is a highly appropriate standard, universally speaking. This means that no matter what your product and no matter what the moisture content, if your water activity is below this level, you will inhibit the majority of degradation processes. This is the fundamental breakthrough of water activity. However, as a standard in specialty coffee, at least as currently traded, it’s just not really that useful.
Green coffee, in particular specialty processed green coffee, is rarely shipped or sampled at this level. It could be, but it is not. This is to say, as an industry we’re already complying with this number, and by a fairly wide margin. There is a good correlation between moisture content and water activity when you’re talking about a single product like green coffee. That correlation is good enough that a person will achieve and is very likely to maintain water activity below 0.7000 99.9 percent of the time by drying their coffee to 12 percent moisture content or less, which is already standard.
From this perspective, it doesn’t add anything to the conversation except cost. This is one of the big points in the report: why would we talk about water activity levels that are two standard deviations above the mean for specialty green coffee? Keeping in mind that when I say “mean for specialty green coffee” I’m using our own data set of around 25,000 samples collected over 6 years to estimate a population value.
Who is the target reader for this report? Producers? Exporters? Importers? Roasters? All of the above? If so, how so for each of those actors?
The target reader here is really all of the above, in particular anyone who is at risk of hearing something about water activity and then acting on that information. Not everyone will need to come away with a perfect understanding of water activity, and in fact, nobody will. This report is far from perfect. But people will come away with a better and more practical understanding of water activity as observed in specialty green coffee. If you’re a producer, exporter, or importer and you want your coffee to ship more consistently, we’ll show you what we’ve observed over six years in around 10,000 longitudinal samples. If you’re a roaster and you want to change the way you roast, or better understand your roasting outcomes, we’ll show you why you probably shouldn’t expect to get that from water activity — looking at both a couple small, casual trials, but again also at analysis of many thousands of live data points.
We’ve aimed to pull back the curtain on water activity and leave off the sugar coating in this report. Given the way that water activity has been floating around in the industry, we can consider this report as a sort of inoculation against some of the wilder claims and the expenses that may arise from them.
Cafe Imports Director of Sensory Analysis Ian Fretheim.
How would you characterize the coffee industry’s current understanding of water activity and its effects on coffee’s shelf-life?
There is a lot to learn. We’ve been at it for six years and 25,000 samples over which we have seen some 10,000 longitudinal samples and we still have a lot to learn. There are many, many variables in green coffee, of course. Water activity is just one of them. It’s both interesting and confounding because it ties in to so many of the others. Our study and this report really give a good whack at cracking some of these open.
Once you began to examine all these data, what were some of the biggest surprises?
The level of correlation between moisture content and water activity. It’s not close enough that I would name an exact moisture content from a water activity level, or vice versa. There’s around 1 percent +/- error in moisture when looking at a water activity level and predicting a moisture content. Nevertheless, this is really close. When you contextualize this error within real coffee observation, in particular over time, it’s pretty minor.
I was also surprised by the high correlation between lipid oxidation type flavors — cardboard, paper, etc. — and high water activity coffee as compared to low or “good” water activity coffee. This correlation held directly- high Aw, high LO flavors. It also held longitudinally — high Aw PSS, high LO flavors. This is important because a high Aw PSS may not be a high Aw arrival.
On a more macro level, one of the biggest surprises was again and again running up against this wall of “we need more data.” I mean, we have so much data, but as soon as you start parsing it out, you need more. A great example of how this is important pivots on coffee being seasonal. You can’t base findings on just one year’s crop. Maybe it was just a great year, or a really tough one; maybe that has nothing to do with water activity; maybe a lower water activity origin has a really strong year and a higher one has a bad year. You can’t rush forward and report that water activity is the culprit. There’s so much more going on. Similarly, if one coffee with low water activity behaves one way and another with high water activity behaves another way, you still don’t know that water activity is impacting that behavior. So these little trials, and we’ve done these ourselves and include some in the report, and also with larger studies like this, these little trials and studies need to be much, much larger, or they need to have much, much more data behind them before you want to go and say something about water activity or coffee more broadly.
In what ways do you intend to use this analysis moving forward, either in conducting future research or as a company that buys green coffee? Are there specific practical applications?
We continue to use Aw as a metric for green analysis among many others. We’ll look to see if an Aw is way out of alignment with moisture content, or if it’s off for an origin, for example.
As we continue to collect data, we can more reliably look at more and more specific slices of our larger data sets.
The practical applications are limited, given a 12 percent moisture content standard. But they exist. A couple of examples: There seems to be increased shelf stability at certain levels. We’ve seen a higher incidence of lipid oxidation on arrival when pre-shipment samples had high water activity. Understanding water activity also has potential application in terms of tuning the coffee storage environment.
Nick Brown
Nick Brown is the editor of Daily Coffee News by Roast Magazine.


Comment
1 Comment
Comments are closed.

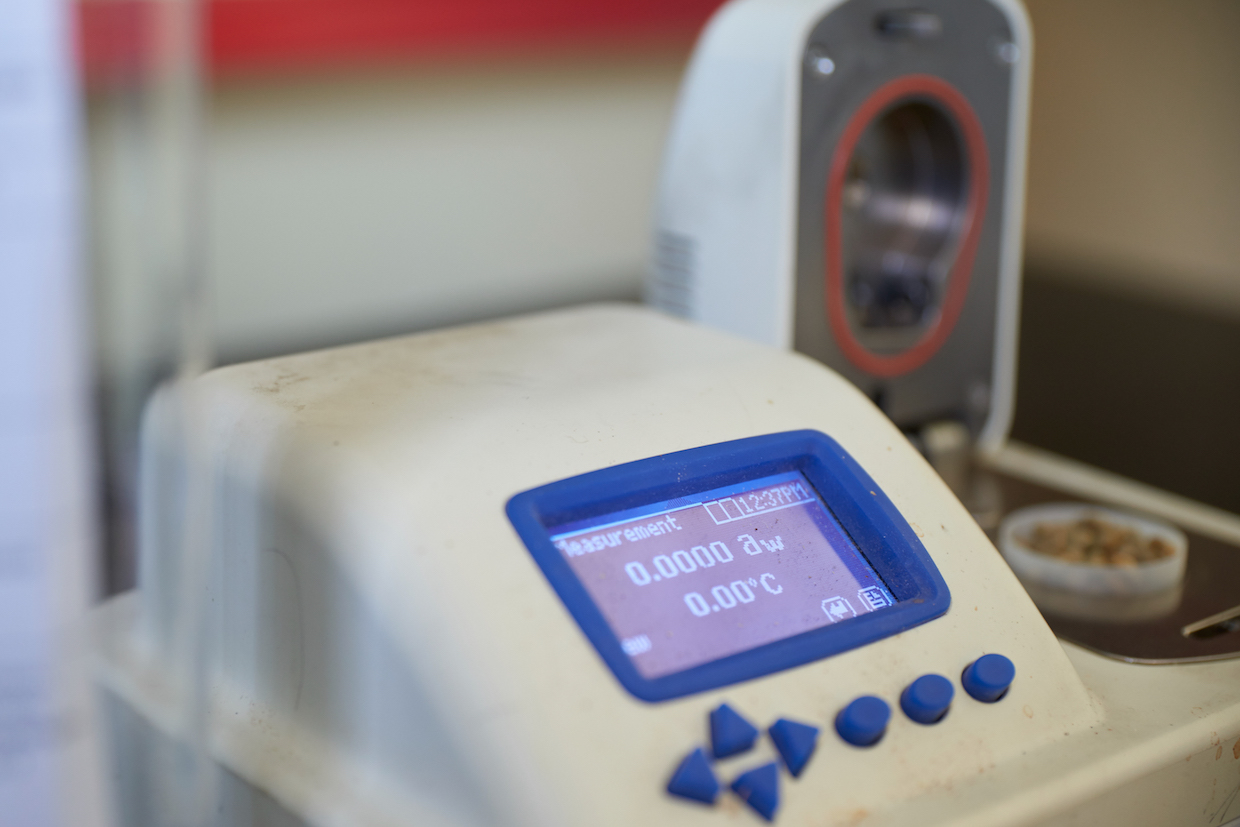
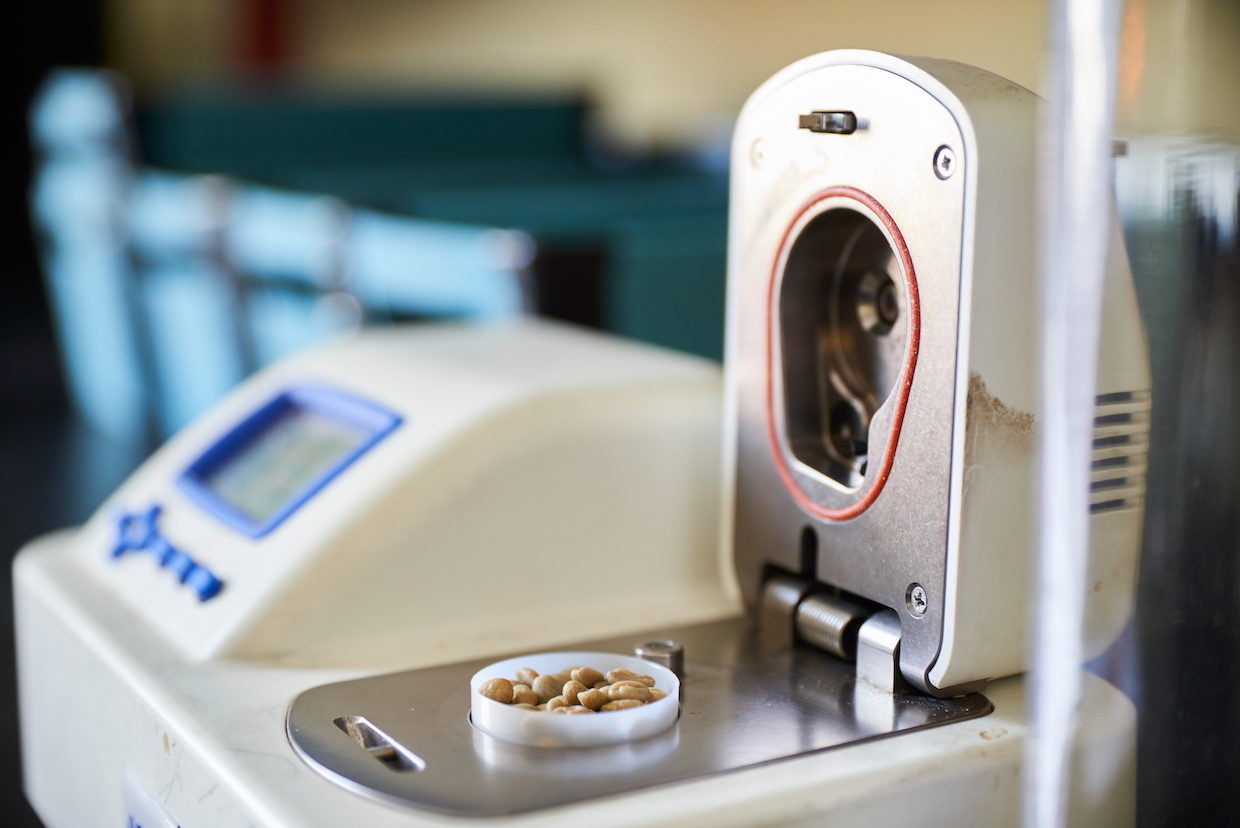
Es muy importante tener un buen medidor de humedad para poder dejar el café a la humedad adecuada de acuerdo a la humedad relativa(RH) y temperatura (DB) ambiental de la zona en donde se almacenará el café. La humedad se debe tomar en café sin cáscara (green coffee). También se debe conocer y monitorear la humedad relativa y temperatura ambiental de la bodega de almacenamiento, conociendo el contenido de humedad de equilibrio del café; por ejemplo: para una zona con temperatura ambiente de 20 grados celsius, la humedad relativa (RH) de la bodega de almacenamiento debe estar en el rango de 65% a 70%.