
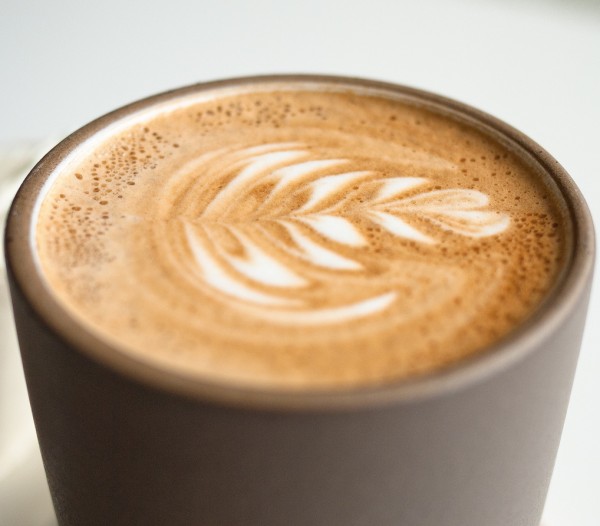
Latte art is trending upward, according to the 2015 Zagat consumer trends survey. 2011 Creative Commons photo “Latte Art” by Kenny Louie.
Google-owned restaurant review surveyor Zagat has released its third annual National Coffee Survey, including some illuminating results on how much U.S. consumers are willing to pay for prepared coffee, as well as gender-based drink preference trends.
The survey gathered replies from nearly 1,500 coffee-drinking respondents throughout the 30-plus markets in which Zagat conducts its restaurant surveys. Respondents reported more frequent consumption and a willingness to pay more for home or barista-prepared coffee than respondents in comparable surveys, like the 2014 National Coffee Association 2014 consumer trends report. For example, 82 percent of the Zagat respondents drink coffee daily, compared to 61 percent in the NCA study.
Here are some of the Zagat study’s most interesting finds for 2015:
Home vs. Retail
Forty three percent of coffee-drinking respondents said they most often make their coffee at home or make/pour it at work. That leaves a relatively whopping 26 percent of people who most often get their coffee from “large national chains” and an equally relatively whopping 22 percent who get their coffee most often from “small chains” or “independents.” The number of people saying they regularly purchase coffee outside the home grew by 8 percent over 2014.
#Trending
According to the Zagat survey, latte art and flat whites — which recently debuted on Starbucks menus — are trending upward among U.S. consumers. For what it’s worth, latte art was measured by levels of apathy and enthusiasm, with 45 percent of respondents saying they “love it.”
Paying More at the Shop
On average, survey participants reported paying $3.28 for a cup of coffee, a noticeable increase from $3.05 in 2014 and $2.98 in 2013. $3.67 was the average price point deemed “too much” for a cup of black coffee. Meanwhile, respondents said an average of $5.07 is the tipping point for “barista-prepared” coffee drinks, representing a 38 percent increase over prepared black coffee.
Drinking More with Age
The national average for coffee drinks consumed per day among all age groups is 2.1, down from 2.3 last year, although respondents reported consuming more drinks with age: people in their 20s (1.8 drinks per day); in their 30s (2.0); in their 40s (2.2); in their 50s (2.4); and in their 60s (2.4). Males of all ages reported consuming more drinks per day (2.4) than did females (1.9).
Specialty Drinks Catching Black Coffee
Black coffee remains the most popular drink among Zagat respondents, although its 24 percent share is down six percent from last year’s results. While “other” captured a 21 percent share of the favorite drink category, popular prepared drinks include: latte (17 percent), cappuccino (12 percent), Americano (8 percent), espresso (8 percent), iced coffee (5 percent), and flavored latte (5 percent).
Preferences by Gender
For 2015, Zagat broke out its data by gender, illustrating some interesting differences in drink preference and retail brand preference. At 22 percent, lattes were the most popular drink type among female consumers, with a regular cup of coffee trailing behind at 19 percent. At 30 percent, a regular cup of coffee was the preferred drink of male respondents, with straight espresso following at 14 percent. When not making coffee at home, females said they prefer buying their drinks at large national chains (31 percent, compared to 20 percent for males), while males responded with a preference for small chains or single-location shops (23 percent).
Tipping and Lingering Etiquette
Zagat has asked two very interesting questions over the past two years: “Do you tip baristas?” and “How long is too long to stay at a coffee shop?” Answers to the latter remained fairly consistent with 2014’s results, with 41 percent of respondents suggesting there is no problem with staying for two or more hours (23 percent said they should be allowed to stay indefinitely). Nearly half of the respondents said staying any time longer than an hour is too long.
Results regarding tipping practices were equally consistent with those in the 2014 study, with 61 reporting regular tipping: 25 percent always tip; 24 percent tip if the barista is friendly; 12 percent tip if the order is complicated. Nine percent of respondents said they don’t tip for non barista-prepared coffee, while 30 percent said they don’t necessarily tip at all. Interestingly, tipping is clearly practiced most among West Coast consumers, while consumers in the Northeast responded as being stingiest with their tips.
Nick Brown
Nick Brown is the editor of Daily Coffee News by Roast Magazine.
Comment
2 Comments
Comments are closed.

Im a 28 yr old female. I drink between 4 to 6 cups of coffee daily. Black with half and half with sweetner. I love making coffee at home. Occasionally buying black coffee from a chain.
I am a home coffee roaster. I make my own coffee (including espresso drinks) 99% of the time. I have no independent cafes near me, and I don’t care for Starbucks coffee or it’s prices. My family of three adults drinks on average 2+ pounds of coffee per week.