
The team at Emory University-based Transparent Trade Coffee has released the first version of its “Specialty Coffee Transaction Guide,” designed as a price discovery tool for both buyers and sellers of specialty-grade green coffee.
The guide is without a doubt the most expansive and informational price reference tool ever tailored to the specialty coffee industry and designed for public use. It also comes at a time when low prices on the commodities market have attracted unprecedented sector-wide attention for their threats to the livelihoods of coffee producers, and the long-term viability of the global arabica sector itself.
For the pilot draft, TTC gathered contract data from 21 donors, including a number of prominent progressive roasters and importers that are primarily based in the United States and Europe. The set of anonymized data involves information from more than 10,000 contracts over the two-year period ending September 2018 that resulted in more than USD $341 million changing hands.
The group describes the 14-page guide as an evolving and expanding price reference tool for the specialty coffee market that intentionally eschews price references from commodities markets.
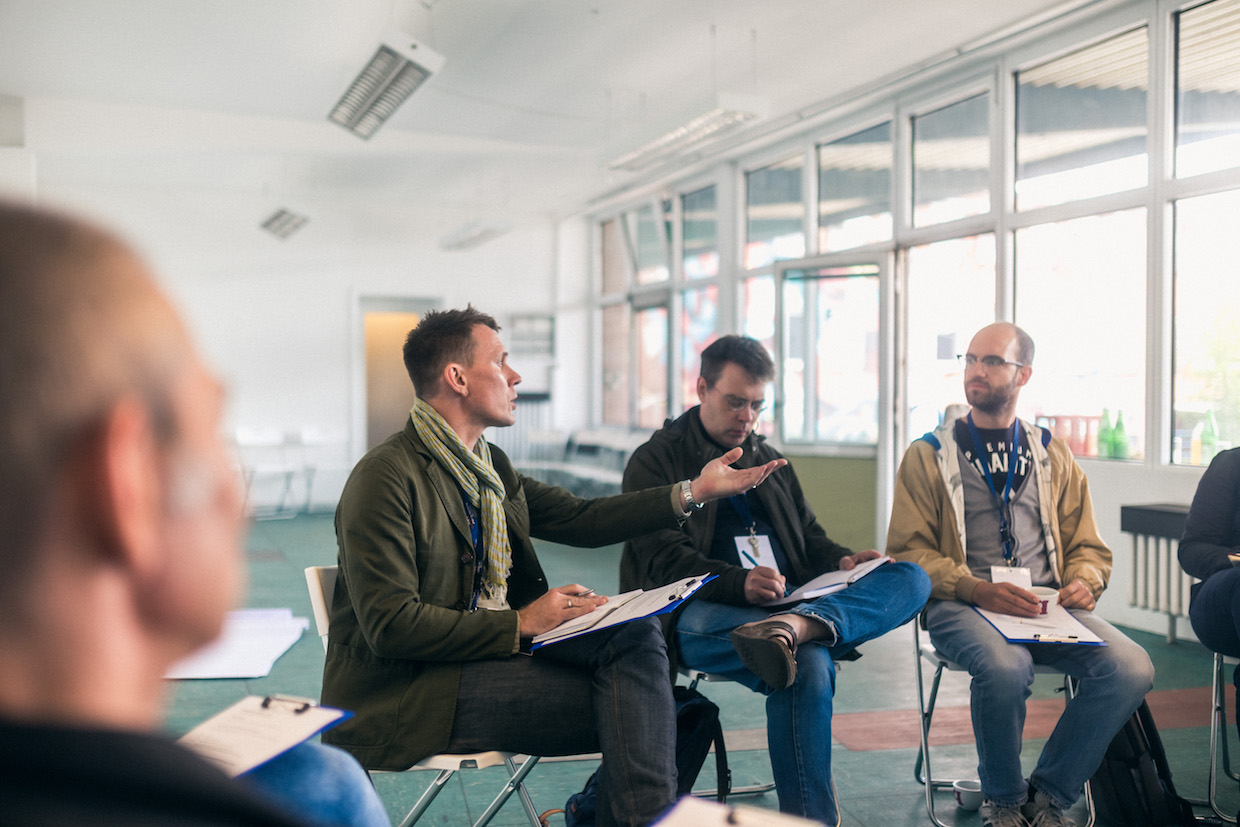
Specialty Coffee Transaction Guide principal Chad Trewick speaking at the 2nd annual Transparent Trade Coffee symposium earlier this year in Hamburg, Germany. File photo courtesy of TTC.
“It’s not meant to challenge or threaten any one value chain actor’s business model,” Chad Trewick, one of the guide project’s two principals along with TTC Founder and Emory University economist Peter Roberts, told DCN. “But we’re in a crisis. There’s no way we can assume we can continue as an industry as we are… It’s time for our industry to have more active conversations and more active conversations about self-preservation.”
Contract data anonymized and shared within the the guide includes, but is not limited to: FOB price; continent on which the coffee was produced; country in which the coffee was produced; purchase size by volume; and quality score. Given these public metrics, the TTC team was able to show how, say, prices for coffees of a similar quality score measured for an 800-2,500-pound purchase against a 40,000+ pound purchase.
For example, for contracts of purchases of volumes between 2,500 and 6,000 pounds, coffees that scored between 82 and 84 fetched $2.49 FOB. At those same volumes, coffees that scored between 84 and 85 fetched $2.62; 85-86 fetched $2.95; 86-88 fetched $3.36; and 88+ fetched $3.95.
In another scenario, coffees of approximately the same quality — say, 86 to 88 for this example — commanded vastly different prices depending on the purchase size, from $2.92 for more than 4,000 pounds, up to $4.50 for less than 80 pounds.
TTC outlines a number of interesting findings in the completed report, while noting that the limited number of donors, though representing substantial volumes, do not reflect the entirety of the specialty market. Trewick told DCN that the group hopes to add approximately 20 more donors to the project in each of the next two years at least, to form a more robust data set that also involves more geographical representation on both the buyer (roaster/importer) side and the producer side.
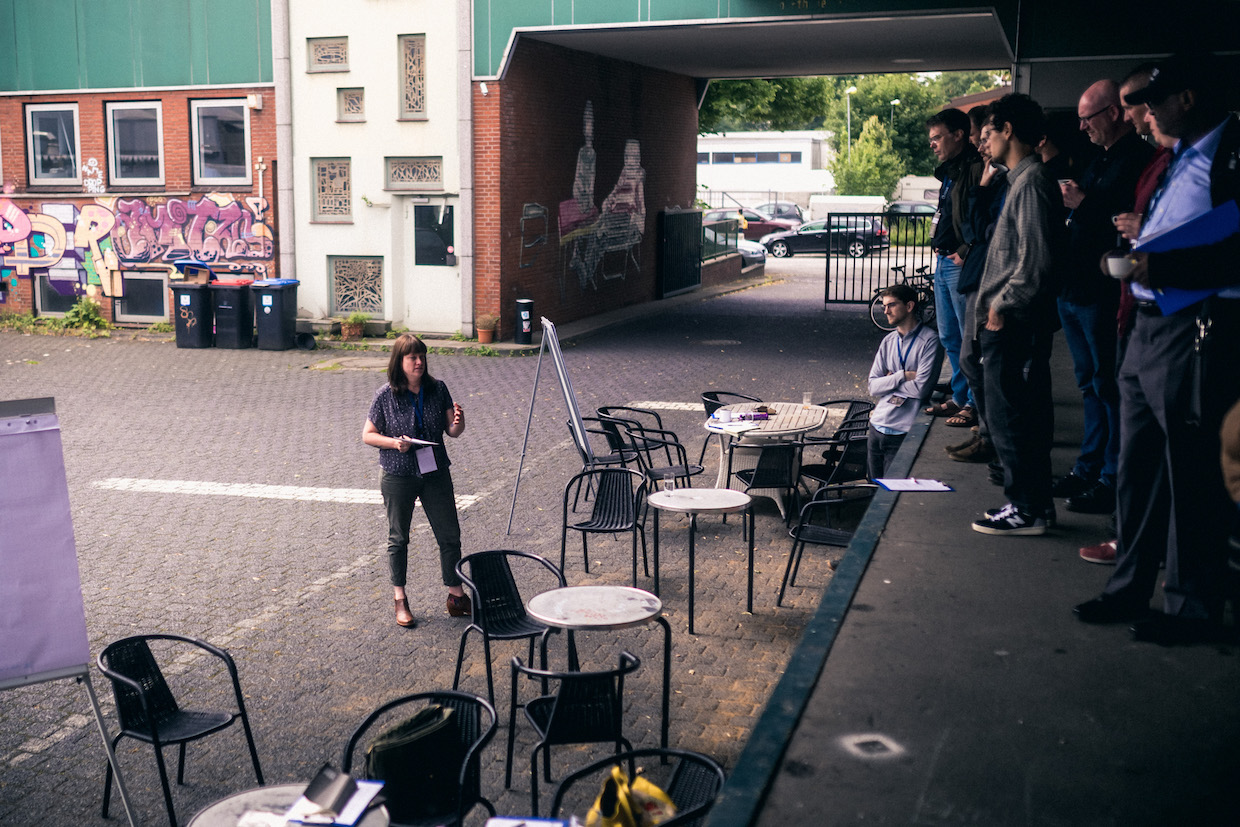
Meredith Taylor of Counter Culture Coffee at the 2nd annual Transparent Trade Coffee symposium earlier this year in Hamburg, Germany. File photo courtesy of TTC.
As the project moves forward, Trewick said he believes the guide can be a transformative tool for both buyers and sellers, while disrupting the traditional price discovery references that have steered the market into its currently unsustainable predicament.
“When you’re a seller or a buyer, you usually start the conversation with what the price was last year, and what the market is this year,” Trewick said, adding that with this guide, the negotiation could commence with something more like, coffees that scored 88 this year cost X amount last year, “so let’s adjust accordingly.”
Trewick said that while there has been near universal enthusiasm for the guide, there has also been some feedback from more old-school-mentality buyers suggesting that the FOB data is largely irrelevant without also including the C price at the time of sale to show the differential. Yet including that would defy the guide’s core purpose, which is to create a reference guide that is wholly untied to the problematic commodities market. Said Trewick, plainly, “We’re not going to do that.”
Interestingly, since the guide was made public last week, nearly half the downloads thus far have been for the Spanish-language version, according to Trewick. It makes sense given the guide’s potential as a reference point for coffee producers.
“Today, it’s a big mystery about why some coffees cost a certain price,” said Trewick, adding that if producers “can’t get what they need or know is possible from their existing relationships, then at least the information is there to empower them to seek a better scenario.”
Daily Coffee News photo by Nick Brown
Yet the TTC team believes the guide is also a benefit to green buyers, too. “I was a buyer and I was always under pressure to adjust my prices to the commodities market or other macro market tools,” Trewick said. But with this guide, he added, “coffee buyers can then justify to their organizations, ‘This is what people are paying for their coffee, and we need this kind of coffee to have our value proposition come through.'”
Donors for the project signed non-disclosure agreements with TTC and vice versa, and the group is in search of additional donors as it expands the guide with refined quality controls and metrics. For the pilot, TTC did its best to ensure that donors submitted all contract data for any purchases of coffee at a quality at 80 or above.
Although it is made possible by the concept of anonymity, the guide is fundamentally about transparency, giving the market a clearer perspective of coffee’s relation to cost.
“[The donors] themselves also know that we have a problem here, a pricing problem where we don’t have the tools as an industry to put appropriate values to coffee,” Trewick said. “We’re not excluding anybody. From our perspective, more data means more representation of pricing behaviors.”
Nick Brown
Nick Brown is the editor of Daily Coffee News by Roast Magazine.

Comment
3 Comments
Comments are closed.

Laudable yet in the most important ways irrelevant effort.
One credible estimate of the size of the ever-nebulous “specialty” market:
“The SCAA or Specialty Coffee Association of America describes true specialty grade coffee as having maximum 5 defects in a standard sample with all cups free of all taints and showing distinctive positive characteristics. Go to http://www.scaa.org for more on the SCAA’s definition of what constitutes specialty grade coffee, defect counts etc.
On the above basis we would estimate that no more than 5% of green coffees could make specialty grade. If we were to include what the SCAA calls high-end premium coffee (8 defects, clean cup) then maybe the specialty market is 10% of all of the green coffee business in the US, a percentage that many trade sources consider realistic. ” (link to full report below).
The obvious point is that high-ish (or at least fair) prices paid for at most 5-10% of world production aren’t going to make a dent in what “C” prices below cost of production are doing. The focus for activism shouldn’t be the quality and price ceiling but the floor and the large multinational roasters who benefit from it.
Long ago it was estimated that if every farmer who grew coffee made U.S. minimum wage Folger’s would cost $15 a pound while specialty would start at $20. In that context, doting on “direct” trade, microlots, COE and all of the rest is an obscene distraction.
http://www.thecoffeeguide.org/coffee-guide/niche-markets-environment-and-social-aspects/the-scope-for-specialty-coffee/
Very interesting tool.It will help us to improve our presentation in coffee marketing.
Meanwhile, could you share same data about the D R Congo ? What’s the principle behind 86 + scores ?
Thanks
Kevin Knox, you raise some interesting points, perticularly concerning the percentage of total worldwide production that qualifies as “specialty”. Considering that ratio, yes, special pricing for special coffees does not help the other 90% and commodity grade production.
One point you make:
“Long ago it was estimated that if every farmer who grew coffee made U.S. minimum wage Folger’s would cost $15 a pound while specialty would start at $20.”
This is almost certainly true.. but a bit of reference is necessary: since here in the US “Tax Feedom Day” is now arriving sometime in July, we effectively work for government (taxation ,fees etc, but not incidental costs not paid to government, such as compliance to regulations costs) for just above the first half of the year. Since in most coffee producing regions government burdens are minimal, one would be rational in reducing the above prices to about half what is quoted. In other words, those in coffee producing areas do not carry the high government burden our minimum wage must cover. If we did not have to bear that burden, we’d be just fine on half the wages we now get.
Actually, when one considers the typical pricing of coffees grown in Hawaii, where producers DO bear the high costs of government, a decent Kona does indeed cost in the neighbourhood of $20, verifying your proposition. (part of why I do not buy them, as I can find a dozen or more better coffees at well below $10 the pound not produced in Kona.)
Perhaps a VERY valuable addition to the dataset in this study would be to include figures for each country of origin that accurately reflect the local cost of living. There are accepted ways of calculating this based on things like cost of an acre/manzana of land outside of a city, cost of renting/buying a typical single family dwelling in a rural setting, cost per gallon/litre of petrol and diesel, perhaps also propane, cost per pound/kilo of a standardised assortment of meats, and produce, average tax paid directly or indirectly by each family, cost of doctor visit, pair of shoes, etc… you get the idea. I’ve known folks, Yankees, who need to have surgery or extensive dental work done, projected to cost ten, twenty thousand dollars, and locate a practitioner in, say, Oaxaca Mexico, or Baguio City PI, pay for round trip air, time off work, nice home to rent, and a car, stay in country for three weeks, get ALL the work done, recover, come home all healed up and have spent well under a quarter the projected US costs.. for work every bit as equal as what is available here.
SO.. the price/lb$US is not, on its own, a fair comparison. Things are far more complicated than just that number.
Also, it would be important to include information on what that dollar figure actually brought… was it the coffee sitting in jute/Grainpro at the farm/mill, or was it in the can dockside ready to load aboard the freighter? In some countries, ground transport is huigely expensive. Adjustments need to be made to compare large red apples to large red apples.
I think this is a good start toward an important bit of discovery, but is, as a first attempt, a rough draft that needs refining going forward.
Thanks for your input.. it helped put some things in perspective.