
In coffee projects around the world, best practices and increasing yields are often the lynchpin in the strategy to improve smallholders’ livelihoods. By definition, a smallholder has a small tract of land, so the logic goes that to compete they need to maximize their production.
However, as smallholders know well, maximizing production often means higher costs, which they cannot finance, and contributes to other negative environmental consequences such as loss of forest cover, loss of diversity, loss of ecosystem services. Therefore, promoted best practices that increase yields often do not result in more profitable farms.
The regional Water Smart Agriculture — Agua y Suelo para la Agricultura (ASA) project has managed, to some extent, to crack the nut, and balance cost of production, increasing yields, and environmental sustainability. On a broad scale — involving 3,000+ farms in Mesoamerica — the project has achieved impressive results, positively impacting farmers’ yields, gross margins and strengthening their water and soil management. Nonetheless, recent data presented below, is as good as an example as any, that low coffee prices undercut the potential of exciting coffee innovations at origin.
Farmers in Eastern Guatemala have been struggling for years with a volatile climate, related pest pressure, and high costs of production and low prices. Three years ago, CRS began a participatory, experimental process with a group of farmers as part of the regional Water Smart Agriculture initiative. The goal was to improve yields, using sustainable soil and water management practices, all the while seeking to limit any increase in cost of production.
The elegant yet complex premise of water-smart agriculture is that a specific set of soil and water management practices that are context specific will improve soil health (composition, nutrient-availability and microorganic activity), and increase green water retention (water stored in the soil and available for plant uptake), resulting in improved productivity.
About 150 farmers volunteered to implement a paired demonstration and comparison plot on their coffee farms. On half the plot (2,500 square meters), they would continue to implement their usual management practices. On the other half (2,500 square meters), they would begin to implement ASA practices.
The two plots were divided to ensure as much homogeneity (shade cover, plant variety, soil type) as possible between them. The ASA package has been implemented by farmers in a progressive, stepwise manner over the past three agricultural cycles.
Practices implemented include: farmer-led, soil quality self-assessments (visual soil evaluation), soil amendments to improve soil pH, diversification and improved management of shade species, and integrated soil fertility management utilizing the 4R methodology of fertilization (right source, right rate, right time, right place). All of these practices are geared towards building up soil organic material, restoring soil health, and reducing runoff by retaining water in the soil.
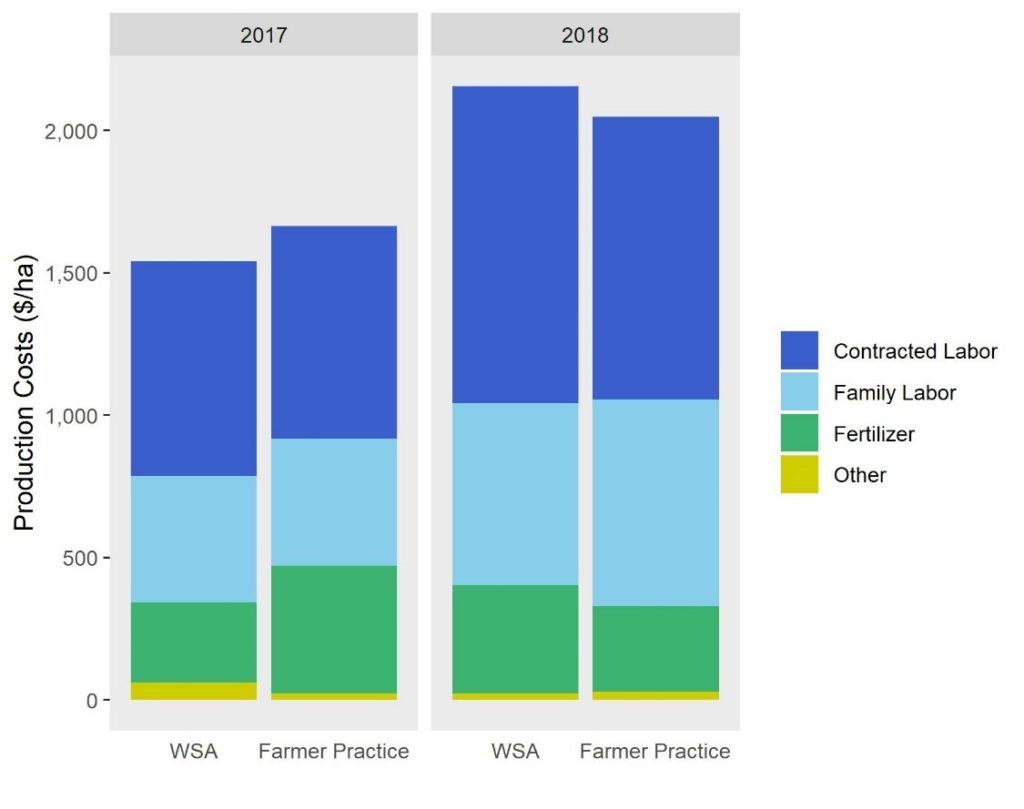
Figure 2: A comparison of ASA and Farmer Practice production costs.
The graph (Figure 2) breaks down the production costs per hectare of coffee. Costs are disaggregated by category and ASA costs are compared to farmer practice costs. In general, over the 2017 and 2018 agricultural cycles, the increased cost of implementing the ASA package was negligible versus the farmers’ traditional practices (lower in 2017), especially if we zero in on the cost of inputs/fertilizer. Most of the difference between the higher ASA production costs in 2018 was the increased cost of contracted labor during the harvest (higher yields = higher cost of harvesting). So far, the transition to an ASA farm looks promising.
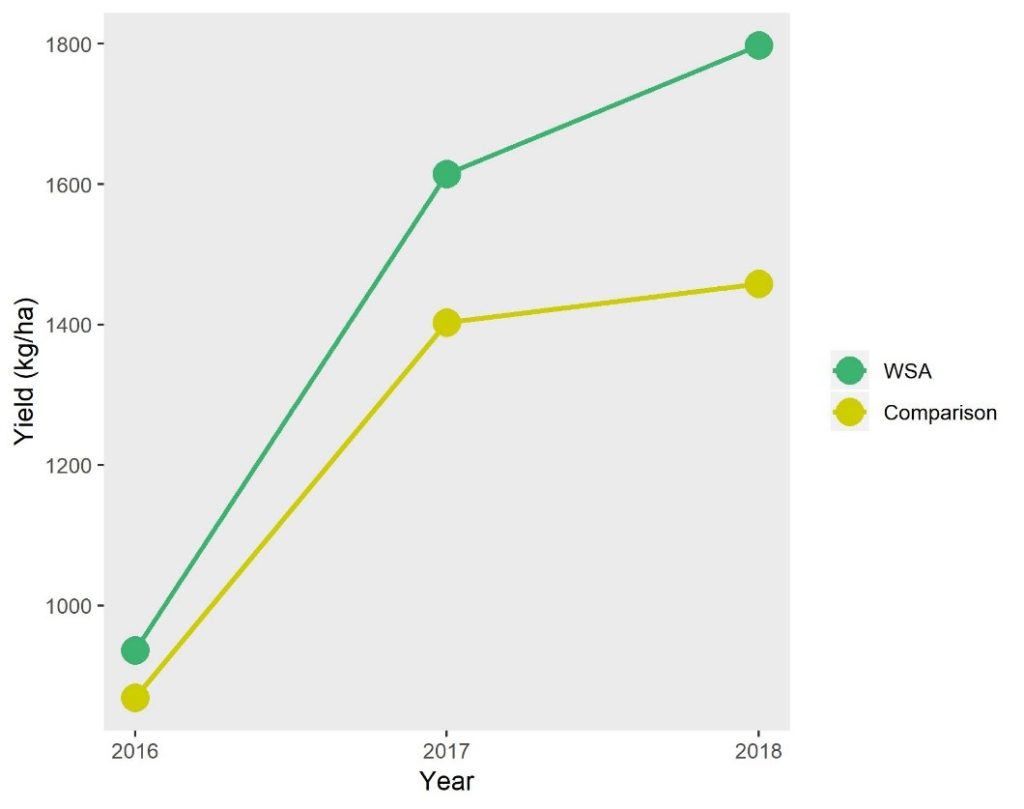
Figure 3: A comparison of ASA and Farmer Practice Yields (Kg green coffee per Ha).
Although production costs on both plots remained relatively stable, the implementation of the ASA package resulted in a substantial jump in yields (Figure 3). Farmers have instituted a new water and soil management paradigm, which targets inefficiencies within their productive system. It is a knowledge-intensive approach that has borne fruit (cherry) for the farmer. Yields have almost doubled (92% increase) since the baseline to an impressive average of 1,800 kilos of green coffee per hectare (26 export sacks).
Of note, the farmer practice plots’ yields (21 export sacks) have also improved. Given that the project has rolled out ASA in a stepwise manner, each year building up the package of practices, individual farmers, convinced by what they are seeing, have begun to partially adopt and invest in some of the initial ASA practices — such as liming to improve soil pH — to their comparison plot, as well as their additional plots of land.[1]
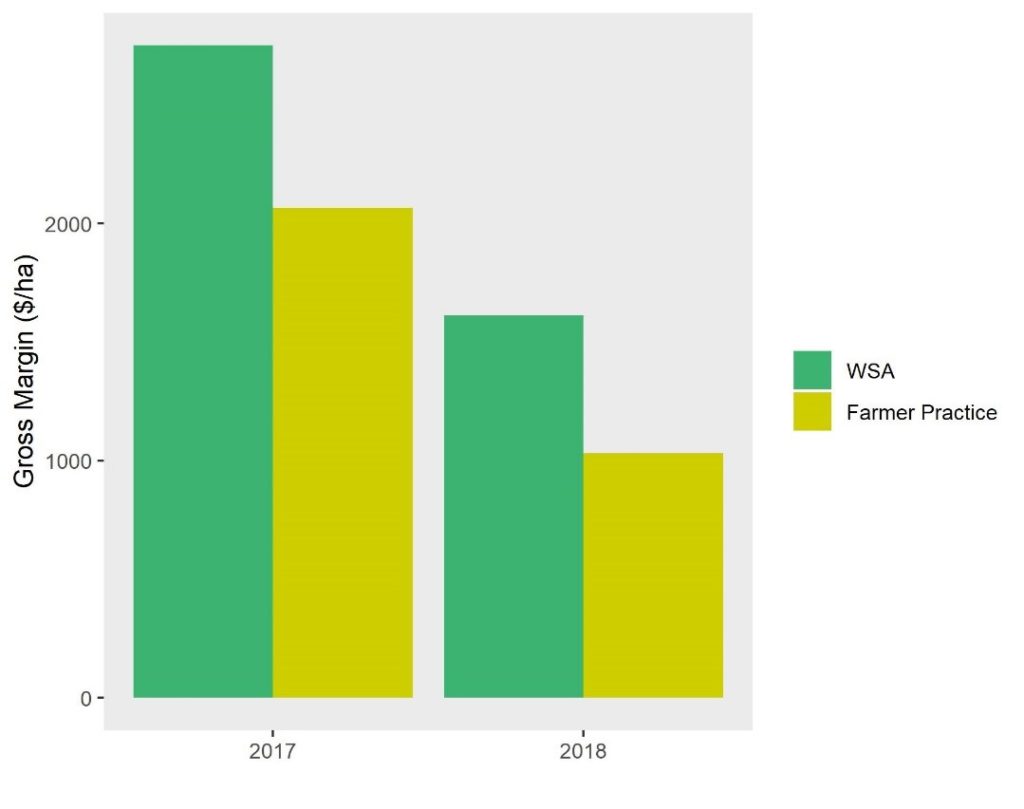
Figure 4: A comparison of ASA and Comparison Gross Margin figures (USD/Ha).
The final graphic (Figure 4) highlights ASA’s significantly higher gross margins[2] over the past two coffee seasons. During the recently concluded harvest, ASA yields were 19% higher resulting in a gross margin that was $600 above the farmer practice margins. This is even more impressive when you realize that the farmer’s plot only generated about $1,000 total on a hectare of coffee. It’s a 36% increase in profit due to improved management practices — all the while minimizing production costs (only a 5% comparative increase).
Unfortunately, this story does not have a happy ending. As we take a closer look at Figure 4, one realizes that the stark drop of global coffee prices[3] this year means that the average farmer’s gross margin is lower in 2018-19 on their ASA plot than compared to last year’s farmer practice plot. The impressive impact of the ASA package on yields has cushioned the blow, but even innovative farmers at origin are unable to remain profitable in the current climate.
(Author’s note: Special thanks to my colleague Dr. Marie-Soleil Turmel for analyzing the data and preparing the graphics which are the backbone of this piece.)
[1] One of the challenges of innovating (experimenting) with smallholders is maintaining a pure control/comparison. As farmers begin to see the benefits of the practices, they have been quick to adopt. In each agricultural year, we have managed to collect robust comparison data. However, with each new year and new ASA practice, the comparison plot, in most cases, has followed along implementing the previous year´s practice. This is clearly a win for practice adoption but not great for having true control plots!
[2] Gross margin calculations only include year over year operating costs up to sale at farm gate. Administration, taxes, and processing costs are not included. Similarly, longer term costs such as partial renovation and rehabilitation are also not included.
[3] We controlled for price using an average price for the region to be able to compare gross margin across the 150 farms. That average price was $2.66/kg in 2017-18 and $2.05/kg in 2018-19.
Dan McQuillan
Dan McQuillan is the Technical Director of CRS-Isidro, a new CRS blended finance initiative that provides a package of technical assistance and investment capital to impactful agricultural enterprises. From 2012-19, he managed Catholic Relief Services' Agriculture Livelihoods portfolio for Guatemala and Mexico.


Comment